
What type of graph is this? I have no idea.
I asked Excel for a line graph, but it looks like it doesn’t want to play ball, even though the x-axis data definitely is taken from continuous dates and times, with values to the nearest second.
I guess it’ll do. It’s not like I’m going to ask the bloody paperclip what went wrong.
This is the output from my messing about with my PokerTracker database in order to try to quantify how lucky or unlucky I’ve been lately.
Since moving up a limit in the turbo sit-and-gos my results have streaked all over the place. I started off with a $500 upswing which came from results that were almost good enough to put me on the Battle of the Planets leaderboard – but not quite.
This excellent run was immediately followed by a $1000 downswing. It all happened very quickly, without me (knowingly) changing the way I played or the way I picked games.
There’s actually very little game selection you can do when a sit-and-go fills up in less than a minute and seating is randomised, but as a rule of thumb if I see a dozen tables in the lobby all with the same 4 or 5 players sitting at them the chances are those players all know what they’re doing so I’ll hang back a few minutes and wait for their games to start before I try some new tables.
I thought I was used to the ups and downs of playing turbo tournaments, but these swings seemed unusually big – and not just because of the higher stakes involved. That $1000 loss on the $27s is equivalent to about $600 on the $16s, and the worst spell I’ve ever had has been a $400 loss before starting to claw it back.
In fact, it’s only because the results were so drastic that I suspected I’d been unusually unfortunate and wasn’t just getting crushed by other players in this game.
I’m not going to get complacent. When you seem to be constantly finishing just outside the money, or only make 3rd place the times you do get there, or clock up more last place results than you’ve had in a long time there’s a good chance there’s some other reason for the bad results than just luck.
However 14 straight sit-and-gos without finishing in the money is a clear personal worst. An actual monkey should get better results than that, as long as he thumps on the mouse often enough not to get timed out.
My dilemma was that I wanted to stick with it and ride out the bad streak but unless I could somehow show myself that I was statistically running bad (and therefore stood a chance of holding my own with "average luck") I was going to have to move back down.
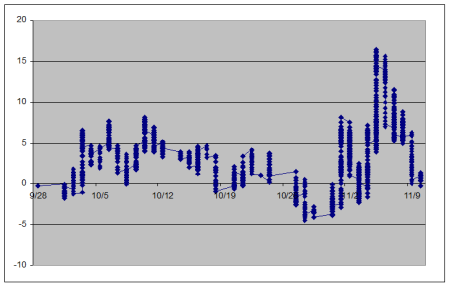
I generated the graph above by pulling out of PokerTracker all the hands where I was all-in pre-flop, either raising first and getting called or calling someone else’s push. In turbo tournaments the blinds get big quickly, so you have to take flips like this a lot.
The query I wrote only looked at hands with two players at showdown (about 6% of my all-ins were 3-way or worse) and ignored split pots. There seems to be a quirk in the PokerTracker database when one player is forced all in on a blind so that it doesn’t know whether he "won" or not (it treats the small stack surviving and the big stack losing less than a big blind as a split pot) so I excluded those hands too (another 5% of my hands).
From this I plugged each hand in turn into poker-eval, grabbed my equity value and used this to plot a cumulative graph of my performance ahead of or behind expectation.
This is a similar concept to Sklansky bucks, but I treated every all-in situation as having the same unit value rather than counting how much money was at stake each time. Converting the amount of tournament chips won or lost on each hand to an amount of real money would just be way too complex – all I cared about was whether I was actually having a bad run of luck, or spewing off my chips to superior players.
The massive slump at the end of the graph is somewhat reassuring, although to be honest I’d rather have my grand back.
The ups and downs in November certainly correspond to my leaderboard-challenging run followed by the doomswitch-fuelled plunge. I moved up on November 5th, which is the 6th vertical line from the right – the one that reaches the highest point on the graph. The values on the y-axis aren’t much use, but the distance of the points from zero and from the previous highs and lows gives you some idea of the extent of each hot and cold streak.
In fact, I would theorise that if you wanted to assess your "luck factor" at any given point in time, it is the gradient of the line on the graph at that point which matters, not the value at that point. If you’re running good, the line is going upwards – regardless of where it started.
So, calculus fans, we need to find d luck by d time.
But I asked Claire how to differentiate my graph and she just laughed at me. Apparently I’d need a formula to do that.
I’m not actually sure whether attempting to capture an abstract concept like luck on a two-dimensional chart is something I should be focusing my efforts on, or just a brief mad scientist moment. Surely if I could find a formula for luck, it would cease to be luck by definition and the world would implode. Muahahaha?
Nevertheless, I did manage to tidy the graph up a bit by removing the date values from the x-axis and plotting results hand by hand instead.
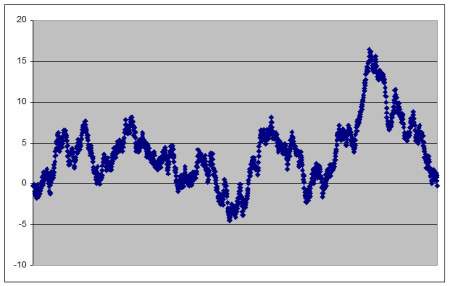
It still looks like it was drawn on blotting paper, but at least it shows what I needed to see in order for me to carry on possibly throwing money away playing poker at this level.
Good luck me?
To measure your “luck” level you should take account of some sort of expectation of hands, both the expectation that a particular hand will win a pot against the number of players at the table and the expectation that your hand will win against the hands shown at the point the money went in.
Although how you’d go about that without writing a specific program for it, I’ve no idea.
For simplicity I only considered pre-flop all-in situations. In the most part, these are much closer to coinflip situations when the money goes in then after the flop so the differential in expectation will be more significant.
I got data out of Poker Tracker like this:
2008-11-10 00:31:22;”KK”;”88″;t;t;f
2008-11-10 00:41:36;”QJo”;”K9o”;f;f;f
Columns are: date, my hand, villain’s hand, did I raise first, did I win, did I bust. In the end I didn’t bother looking at whether I was the aggressor or playing for all my chips though.
I then grabbed the equity of each hand, in these cases 0.802 and 0.422 respectively.
My graph plots how far I am ahead of expectation, so a win on the first hand was 0.198 ahead; then a loss on the second was 0.422 behind, so I’d add 0.198, subtract 0.422 … to get the cumulative total.
Does that make any sense?
Also I just ran the numbers on how often the all-in comes pre-flop vs after the flop. For all players in my database it’s 81% pre-flop, and for my own hands it’s 94% pre-flop!
Do you have autograph, this can be quite effective at dealing with statistical graphs
No. Can it really find d luck by d time?
I’ve given up at the $27s, at least for a while.I’m on an absolutely horrible downswing, and for as much as I genuinely think I’m running abnormally poorly I’m just not confident enough that it’s the only reason I’m leaking money at hyperspeed. So, I’m g